How Much Energy Does a Solar Panel Produce per Day?
A solar panel produces about its rated watts × your peak sun hours × 0.86 per day. With about 5 peak sun hours, the average of our 50 U.S. reference cities for a panel angled toward the sun, a 100 W panel makes roughly 430 Wh a day and a 400 W panel about 1.7 kWh. Location and season change that a lot: the same 100 W panel averages about 570 Wh a day in Phoenix but only about 140 Wh in a Seattle December.
The formula
energy per day (Wh) = panel watts × peak sun hours × 0.86
Example: 400 W × 4.5 h × 0.86 = 1,548 Wh (1.55 kWh)
Many calculators skip the last factor and multiply only watts by sun hours (400 W × 4.5 h = 1.8 kWh). Real panels lose energy along the way, so that shortcut overstates what you’ll get. The 0.86 is the default 14% total loss used by PVWatts, the solar calculator from the U.S. National Laboratory of the Rockies (NLR, formerly NREL). It covers dirt on the panel (2%), shading (3%), wiring (2%), mismatch between panels (2%), connections, early light-induced degradation, nameplate tolerance and availability.
If the energy goes into a portable power station, there’s one more step: charging the battery. Our Solar Panel Size Calculator adds that loss and tells you how long a recharge takes.
What “peak sun hours” means
A panel’s rating in watts is measured in the lab at 1,000 watts of sunlight per square meter with the cells at 25°C (77°F). Peak sun hours convert a whole day of changing light into the number of hours at that full strength. A day with 5 peak sun hours delivers as much solar energy as 5 hours at 1,000 W/m², even if the sun was up for 12.
Peak sun hours depend on:
- Where you are. The Southwest gets far more than the Pacific Northwest.
- The season. Winter days are shorter and the sun is lower.
- The panel’s angle. A panel tilted toward the sun collects more than one lying flat for most of the year. In December, a flat panel gets only about 55% of what an angled one does, averaged across U.S. states.
Daily output by month: three cities
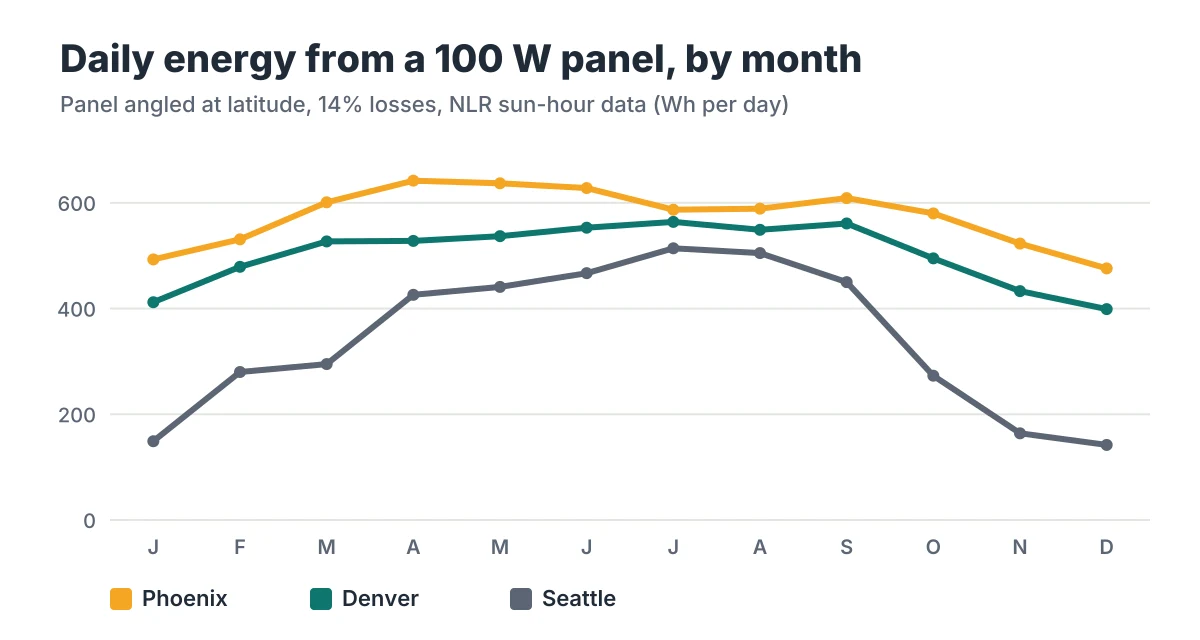
A 100 W panel angled at the latitude, with 14% losses:
| City | Year-round average | Best month | December |
|---|---|---|---|
| Phoenix, AZ | 574 Wh/day | 642 Wh/day (April) | 476 Wh/day |
| Denver, CO | 503 Wh/day | 564 Wh/day (July) | 399 Wh/day |
| Seattle, WA | 342 Wh/day | 514 Wh/day (July) | 142 Wh/day |
The year-round average hides the swing. A Seattle panel produces less than a third as much in December as in July. If you depend on solar in winter, size for the worst month, not the average.
Output by state
Estimated daily and yearly output for one city per state, for a panel angled toward the sun at the latitude, with 14% losses. The 100 W column fits a typical portable panel; the 400 W column fits a typical rooftop-size module.
| State | City | Sun hours (year avg) | 100 W panel, Wh/day | 400 W panel, kWh/day | 400 W panel, kWh/year | 400 W panel, worst month (kWh/day) |
|---|---|---|---|---|---|---|
| Alabama | Huntsville | 4.9 | 421 | 1.69 | 615 | 1.20 (Dec) |
| Alaska | Anchorage | no data | – | – | – | – |
| Arizona | Phoenix | 6.7 | 574 | 2.30 | 839 | 1.90 (Dec) |
| Arkansas | Little Rock | 5.0 | 427 | 1.71 | 624 | 1.27 (Dec) |
| California | Los Angeles | 6.1 | 521 | 2.08 | 761 | 1.62 (Dec) |
| Colorado | Denver | 5.8 | 503 | 2.01 | 735 | 1.60 (Dec) |
| Connecticut | Bridgeport | 4.5 | 390 | 1.56 | 570 | 1.07 (Dec) |
| Delaware | Wilmington | 4.8 | 414 | 1.65 | 604 | 1.23 (Dec) |
| District of Columbia | Washington | 4.9 | 419 | 1.68 | 611 | 1.27 (Dec) |
| Florida | Jacksonville | 5.3 | 457 | 1.83 | 667 | 1.48 (Dec) |
| Georgia | Atlanta | 5.1 | 438 | 1.75 | 639 | 1.30 (Dec) |
| Hawaii | Honolulu | 6.0 | 513 | 2.05 | 750 | 1.70 (Dec) |
| Idaho | Boise | 5.5 | 471 | 1.89 | 688 | 0.97 (Dec) |
| Illinois | Chicago | 4.5 | 387 | 1.55 | 565 | 0.91 (Dec) |
| Indiana | Indianapolis | 4.6 | 396 | 1.58 | 578 | 0.99 (Dec) |
| Iowa | Des Moines | 4.7 | 406 | 1.62 | 593 | 1.10 (Jan) |
| Kansas | Wichita | 5.3 | 458 | 1.83 | 669 | 1.39 (Dec) |
| Kentucky | Louisville | 4.7 | 404 | 1.62 | 590 | 1.03 (Dec) |
| Louisiana | New Orleans | 5.1 | 440 | 1.76 | 643 | 1.39 (Dec) |
| Maine | Portland | 4.6 | 398 | 1.59 | 581 | 1.11 (Nov) |
| Maryland | Baltimore | 4.8 | 417 | 1.67 | 609 | 1.26 (Dec) |
| Massachusetts | Boston | 4.6 | 393 | 1.57 | 574 | 1.09 (Dec) |
| Michigan | Detroit | 4.4 | 379 | 1.52 | 554 | 0.85 (Dec) |
| Minnesota | Minneapolis | 4.6 | 392 | 1.57 | 573 | 1.04 (Dec) |
| Mississippi | Jackson | 5.1 | 439 | 1.75 | 640 | 1.27 (Dec) |
| Missouri | Kansas City | 5.0 | 427 | 1.71 | 624 | 1.30 (Dec) |
| Montana | Billings | 5.0 | 428 | 1.71 | 625 | 0.99 (Dec) |
| Nebraska | Omaha | 4.9 | 424 | 1.70 | 619 | 1.18 (Dec) |
| Nevada | Las Vegas | 6.7 | 575 | 2.30 | 840 | 1.84 (Dec) |
| New Hampshire | Manchester | 4.5 | 390 | 1.56 | 570 | 1.10 (Dec) |
| New Jersey | Newark | 4.7 | 402 | 1.61 | 586 | 1.16 (Dec) |
| New Mexico | Albuquerque | 6.6 | 565 | 2.26 | 825 | 1.91 (Dec) |
| New York | New York City | 4.6 | 397 | 1.59 | 580 | 1.15 (Dec) |
| North Carolina | Charlotte | 5.2 | 446 | 1.79 | 652 | 1.40 (Dec) |
| North Dakota | Fargo | 4.3 | 374 | 1.50 | 546 | 0.69 (Jan) |
| Ohio | Columbus | 4.5 | 384 | 1.53 | 560 | 0.94 (Dec) |
| Oklahoma | Oklahoma City | 5.4 | 465 | 1.86 | 679 | 1.50 (Dec) |
| Oregon | Portland | 4.0 | 347 | 1.39 | 507 | 0.62 (Dec) |
| Pennsylvania | Philadelphia | 4.7 | 406 | 1.62 | 593 | 1.21 (Dec) |
| Rhode Island | Providence | 4.6 | 395 | 1.58 | 576 | 1.13 (Dec) |
| South Carolina | Charleston | 5.3 | 459 | 1.84 | 670 | 1.45 (Dec) |
| South Dakota | Sioux Falls | 4.8 | 410 | 1.64 | 599 | 1.05 (Jan) |
| Tennessee | Nashville | 4.8 | 414 | 1.65 | 604 | 1.13 (Dec) |
| Texas | Houston | 5.0 | 427 | 1.71 | 623 | 1.30 (Dec) |
| Utah | Salt Lake City | 5.5 | 474 | 1.90 | 692 | 1.17 (Dec) |
| Vermont | Burlington | 4.3 | 366 | 1.47 | 535 | 0.83 (Dec) |
| Virginia | Virginia Beach | 4.9 | 424 | 1.70 | 619 | 1.28 (Dec) |
| Washington | Seattle | 4.0 | 342 | 1.37 | 500 | 0.57 (Dec) |
| West Virginia | Charleston | 4.5 | 387 | 1.55 | 565 | 1.04 (Dec) |
| Wisconsin | Milwaukee | 4.5 | 390 | 1.56 | 570 | 0.98 (Dec) |
| Wyoming | Cheyenne | 5.5 | 476 | 1.90 | 694 | 1.38 (Dec) |
Sun hours come from the NLR Solar Resource API (satellite data averaged over 1998–2009, about 10 km resolution), retrieved on September 26, 2026. The dataset doesn’t include Alaska. One city can’t represent every part of a large state, so treat these as reference points.
What else lowers output
- Heat. Panels produce less as their cells get hotter. PVWatts assumes a loss of about 0.35% per °C for premium modules and 0.47% per °C for standard ones above the 25°C rating temperature. As an illustration, cells running 30°C above that would lose roughly 10 to 14% of their output. Check the temperature coefficient on your panel’s spec sheet.
- Angle and direction. A panel lying flat loses a lot in winter, as shown above. Portable panels on a kickstand can be re-aimed during the day.
- Shade and dirt. Keep the whole panel in full sun and wipe off dust; both are part of the 14% default loss, and the loss grows if the panel is dirty or partly shaded.
- Age. Panels slowly lose output over the years; the manufacturer’s warranty usually states how much.
How to use these numbers
- Charging a portable power station: divide the station’s capacity by the panel’s daily output to get a rough number of days, or use the Solar Panel Size Calculator, which adds charging losses and the station’s solar input limit.
- Camping with solar: our camping guide shows how a daily recharge can shrink the battery you need.
- Sizing your system: start from what you use per day, as in our sizing guide, and pick panel watts that cover it in the worst month you’ll use them.
We cover portable panels and power stations. For a rooftop solar system connected to your home, talk to a licensed installer, who will model your specific roof, shading and local rules.
To see where our numbers come from, read How We Research.