
Solar Panel Size Calculator for Power Stations
Divide the energy you want per day by your location’s peak sun hours and by about 0.77 for real-world losses. In Phoenix, 500 Wh a day takes about a 100 W panel on an average day. In Seattle in December, the same 500 Wh takes about 390 W. Pick your state below to get your numbers, including the worst month of the year.
How the calculator works
panel watts = energy per day (Wh) ÷ (peak sun hours × 0.77)
days to recharge = station Wh ÷ (panel watts × peak sun hours × 0.77)
Peak sun hours are the number of hours per day the sun would need to shine at full strength (1,000 watts per square meter) to deliver the day’s total solar energy. A day with 5 peak sun hours doesn’t mean 5 hours of sunshine; it means the whole day’s light adds up to what 5 hours at full strength would give. A panel rated at 100 W produces, at best, about 100 Wh for each peak sun hour.
The 0.77 combines two factors (0.86 × 0.90, rounded):
- 0.86 for system losses. It’s the default 14% total loss in PVWatts, the solar calculator from the U.S. National Laboratory of the Rockies (NLR, formerly NREL). It covers dirt on the panel, partial shade, wiring, mismatch between panels and small rating differences.
- 0.90 for charging the battery. This is our planning assumption for the station’s charge controller and battery losses, not a measured value for any model.
Panels also produce less when they’re hot, and the calculator doesn’t model that separately. Treat the results as a planning estimate and keep a margin.
Where the sun-hour numbers come from
The state data comes from the NLR Solar Resource API, which reports monthly averages from satellite data for 1998–2009 on a grid of about 10 km. We took one point per state, at its most populated city, on September 26, 2026. Two versions:
- Angled toward the sun: a panel tilted at an angle equal to your latitude, facing south. This is close to a folding panel propped up on its kickstand and pointed at the sun.
- Lying flat: a horizontal panel, like one left flat on the ground or on a van roof.
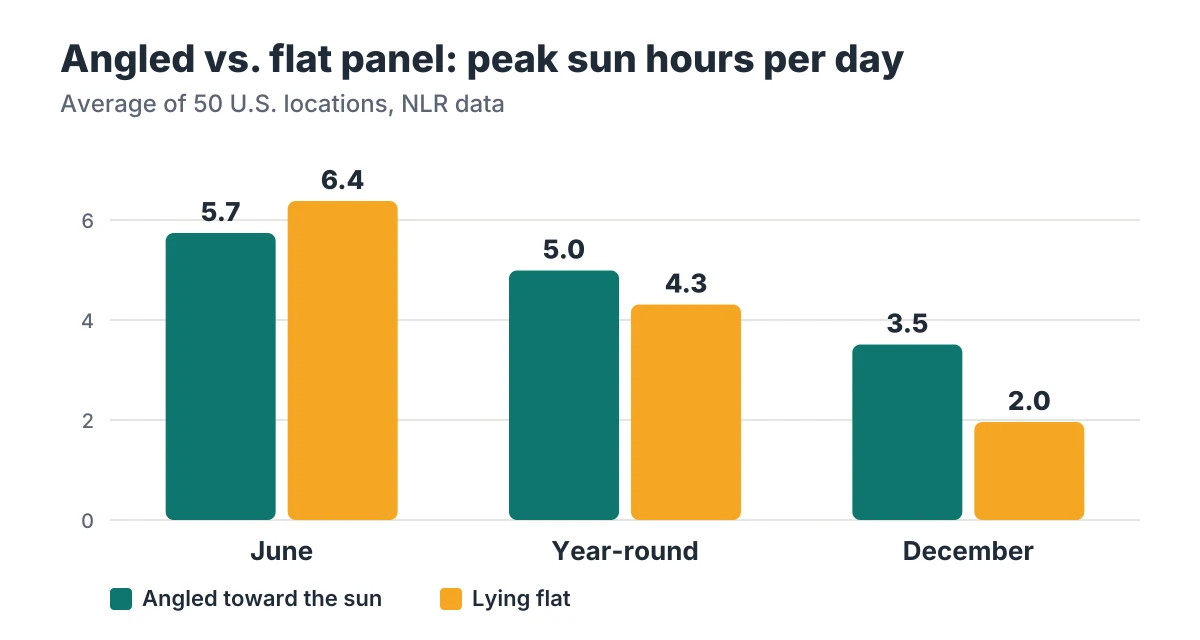
The difference is bigger than most people expect. Across the states in our table, a flat panel gets about 86% of the sun an angled one gets over a year, but only about 55% in December, when the sun is low. In June it flips: with the sun high in the sky, a flat panel gets slightly more than an angled one (about 6.4 versus 5.7 hours on average). If you only camp in summer, flat is fine; for spring, fall and winter, angle it.
The dataset doesn’t cover Alaska. If you’re there, or if you want a more precise number for your exact location, enter your own peak sun hours in the calculator.
Peak sun hours by state
Peak sun hours per day for one city in each state, from NLR data:
| State | City | Angled panel, year avg | Angled panel, worst month | Flat panel, year avg |
|---|---|---|---|---|
| Alabama | Huntsville | 4.9 | 3.5 (Dec) | 4.3 |
| Alaska | Anchorage | no data | no data | no data |
| Arizona | Phoenix | 6.7 | 5.5 (Dec) | 5.8 |
| Arkansas | Little Rock | 5.0 | 3.7 (Dec) | 4.4 |
| California | Los Angeles | 6.1 | 4.7 (Dec) | 5.3 |
| Colorado | Denver | 5.8 | 4.6 (Dec) | 4.8 |
| Connecticut | Bridgeport | 4.5 | 3.1 (Dec) | 3.9 |
| Delaware | Wilmington | 4.8 | 3.6 (Dec) | 4.1 |
| District of Columbia | Washington | 4.9 | 3.7 (Dec) | 4.2 |
| Florida | Jacksonville | 5.3 | 4.3 (Dec) | 4.8 |
| Georgia | Atlanta | 5.1 | 3.8 (Dec) | 4.5 |
| Hawaii | Honolulu | 6.0 | 4.9 (Dec) | 5.7 |
| Idaho | Boise | 5.5 | 2.8 (Dec) | 4.6 |
| Illinois | Chicago | 4.5 | 2.6 (Dec) | 3.9 |
| Indiana | Indianapolis | 4.6 | 2.9 (Dec) | 4.0 |
| Iowa | Des Moines | 4.7 | 3.2 (Jan) | 4.0 |
| Kansas | Wichita | 5.3 | 4.0 (Dec) | 4.6 |
| Kentucky | Louisville | 4.7 | 3.0 (Dec) | 4.1 |
| Louisiana | New Orleans | 5.1 | 4.0 (Dec) | 4.6 |
| Maine | Portland | 4.6 | 3.2 (Nov) | 3.8 |
| Maryland | Baltimore | 4.8 | 3.7 (Dec) | 4.1 |
| Massachusetts | Boston | 4.6 | 3.2 (Dec) | 3.8 |
| Michigan | Detroit | 4.4 | 2.5 (Dec) | 3.8 |
| Minnesota | Minneapolis | 4.6 | 3.0 (Dec) | 3.8 |
| Mississippi | Jackson | 5.1 | 3.7 (Dec) | 4.6 |
| Missouri | Kansas City | 5.0 | 3.8 (Dec) | 4.3 |
| Montana | Billings | 5.0 | 2.9 (Dec) | 4.1 |
| Nebraska | Omaha | 4.9 | 3.4 (Dec) | 4.2 |
| Nevada | Las Vegas | 6.7 | 5.4 (Dec) | 5.7 |
| New Hampshire | Manchester | 4.5 | 3.2 (Dec) | 3.8 |
| New Jersey | Newark | 4.7 | 3.4 (Dec) | 4.0 |
| New Mexico | Albuquerque | 6.6 | 5.5 (Dec) | 5.6 |
| New York | New York City | 4.6 | 3.3 (Dec) | 3.9 |
| North Carolina | Charlotte | 5.2 | 4.1 (Dec) | 4.5 |
| North Dakota | Fargo | 4.3 | 2.0 (Jan) | 3.7 |
| Ohio | Columbus | 4.5 | 2.7 (Dec) | 3.9 |
| Oklahoma | Oklahoma City | 5.4 | 4.3 (Dec) | 4.7 |
| Oregon | Portland | 4.0 | 1.8 (Dec) | 3.5 |
| Pennsylvania | Philadelphia | 4.7 | 3.5 (Dec) | 4.0 |
| Rhode Island | Providence | 4.6 | 3.3 (Dec) | 3.9 |
| South Carolina | Charleston | 5.3 | 4.2 (Dec) | 4.7 |
| South Dakota | Sioux Falls | 4.8 | 3.0 (Jan) | 4.0 |
| Tennessee | Nashville | 4.8 | 3.3 (Dec) | 4.3 |
| Texas | Houston | 5.0 | 3.8 (Dec) | 4.5 |
| Utah | Salt Lake City | 5.5 | 3.4 (Dec) | 4.7 |
| Vermont | Burlington | 4.3 | 2.4 (Dec) | 3.6 |
| Virginia | Virginia Beach | 4.9 | 3.7 (Dec) | 4.3 |
| Washington | Seattle | 4.0 | 1.6 (Dec) | 3.5 |
| West Virginia | Charleston | 4.5 | 3.0 (Dec) | 4.0 |
| Wisconsin | Milwaukee | 4.5 | 2.8 (Dec) | 3.9 |
| Wyoming | Cheyenne | 5.5 | 4.0 (Dec) | 4.6 |
A single city stands in for a whole state, and states like California or Texas have very different climates inside them. Use the calculator’s manual field if you know a better number for your area.
Two examples
Keeping up with 500 Wh a day. That’s roughly a 12V fridge, some lights and phone charging, as in our camping guide.
Phoenix, year-round average (6.68 h): 500 ÷ (6.68 × 0.77) = 97 W
Seattle, year-round average (3.98 h): 500 ÷ (3.98 × 0.77) = 163 W
Seattle, December (1.65 h): 500 ÷ (1.65 × 0.77) = 394 W
The same daily use needs four times more panel in a Seattle December than in an average Phoenix day. If you camp year-round in the north, size for the worst month or plan to recharge another way.
Recharging a 1,056 Wh station with 200 W of panels in Denver. A station like the Anker SOLIX C1000 (1,056 Wh, up to 600 W of solar input, 11–60 V):
Year-round average (5.85 h): 1,056 ÷ (200 × 5.85 × 0.77) = 1.2 days
December (4.64 h): 1,056 ÷ (200 × 4.64 × 0.77) = 1.5 days
Tips for getting the most from portable panels
- Angle the panel toward the sun. Use the kickstand, and re-aim it a couple of times a day if you can. In winter, a flat panel can lose nearly half its output.
- Avoid shade. Keep the whole panel in full sun; shade on part of it reduces what it produces.
- Check the station’s solar input limits. Every station has a maximum solar input in watts and an allowed voltage range. For example, the EcoFlow RIVER 3 Plus accepts up to 220 W, and the Anker SOLIX C1000 up to 600 W at 11–60 V. Panels above the watt limit won’t charge faster, and panels outside the voltage range may not charge at all. Check the panel’s open-circuit voltage before connecting panels in series.
- Size the battery for bad days. Solar output changes with the weather. Our sizing guide shows how to size capacity with a margin, and the runtime calculator tells you how long your battery lasts between sunny days.
Safety: Portable panels are for charging portable stations. Don’t connect panels or a power station to your home’s electrical panel or wiring yourself; that requires equipment installed by a licensed electrician. Follow the station’s manual for its solar input limits and operating temperatures.
To see where our numbers come from, read How We Research.